What does it take to sell a car?
10 september 2026, PaulI have been fine-tuning my portals dashboard for quite some time now. It is a dashboard that lets you compare four portals and Gaspedaal at a glance and calculate the ROI on your investment.
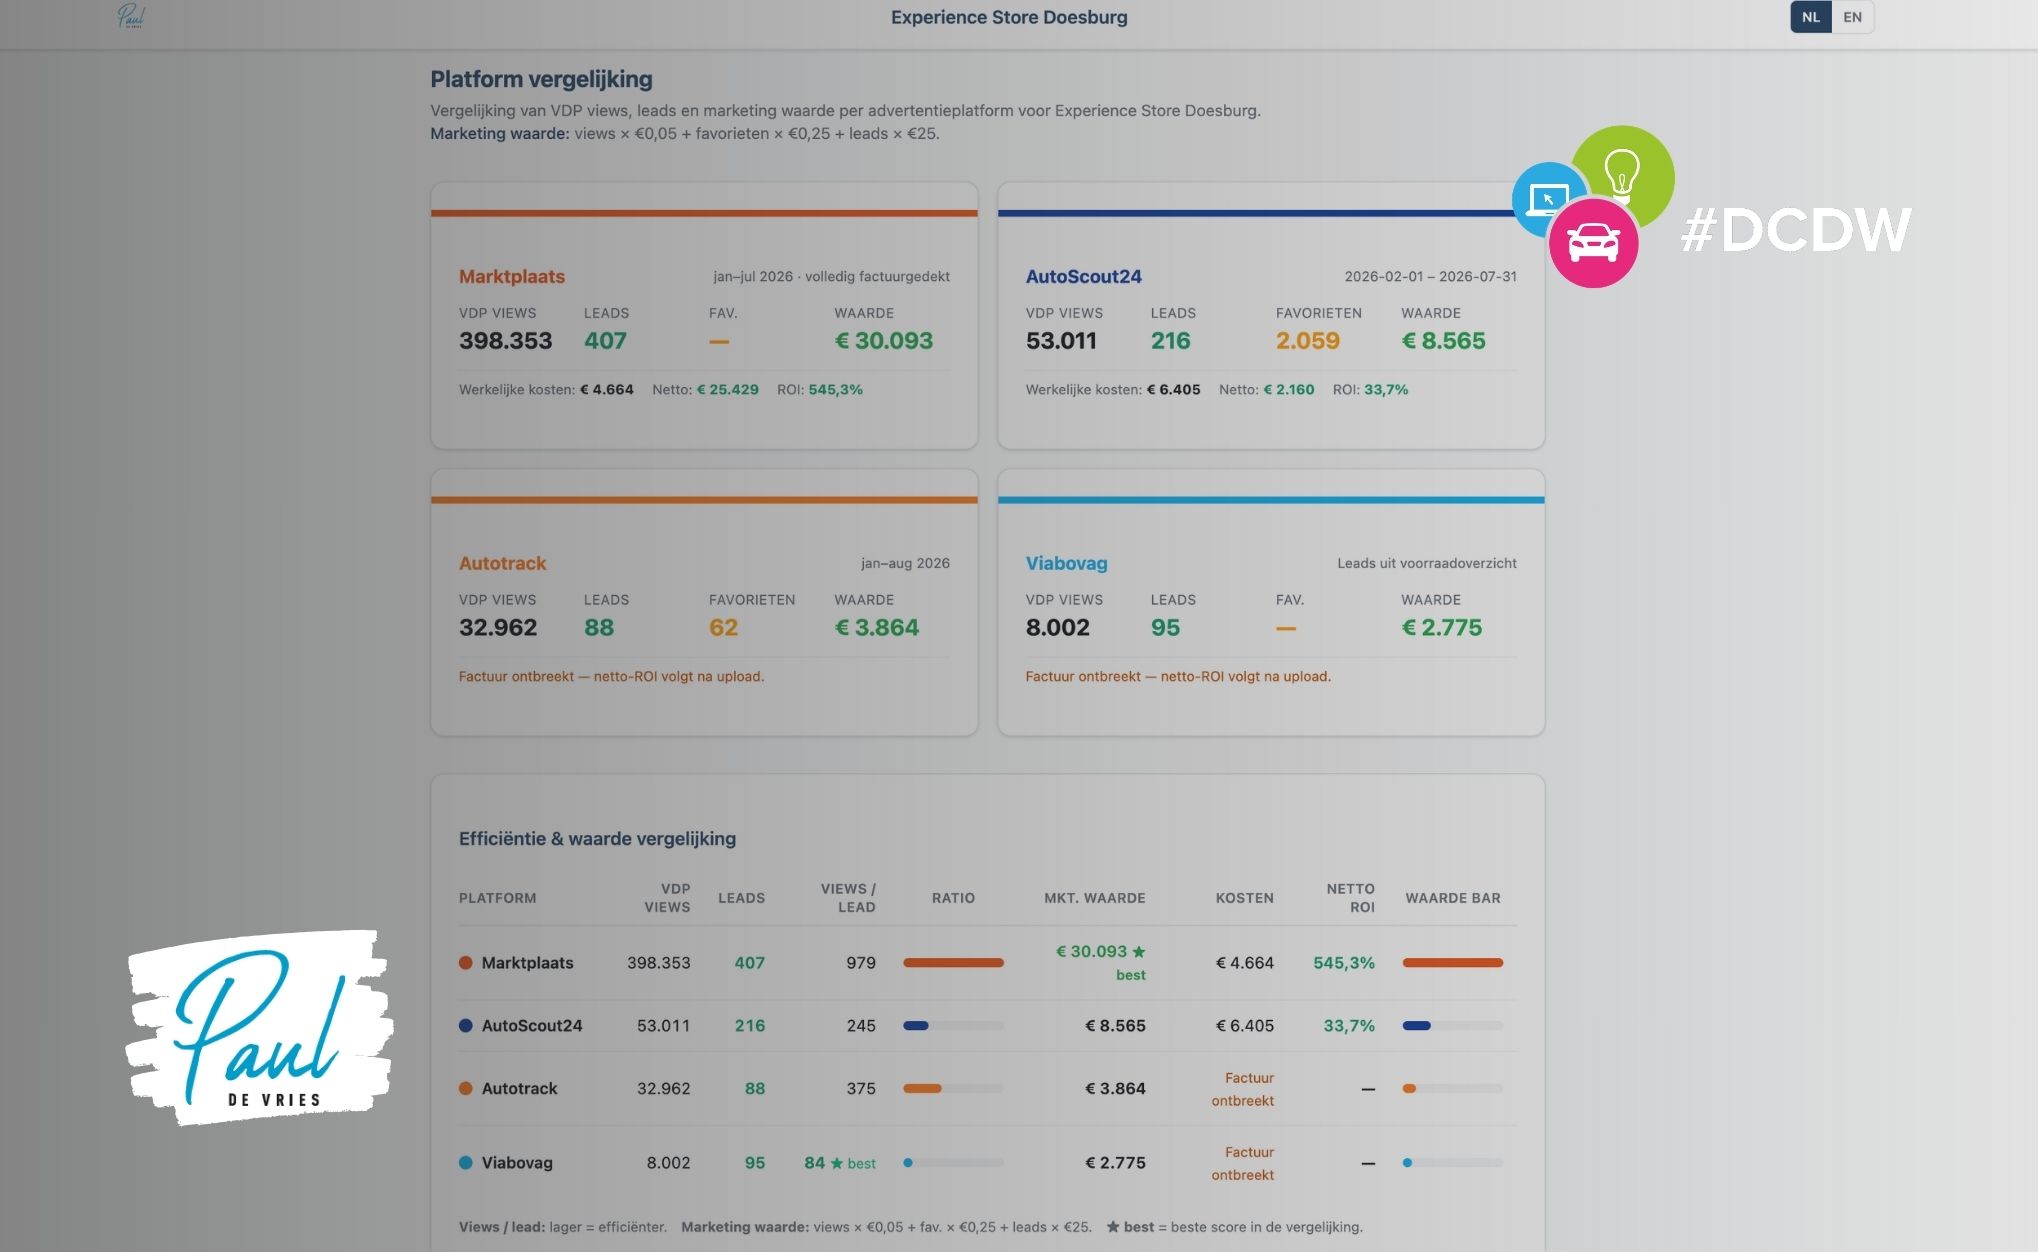
4 portals side by side, Experience Store Doesburg
Live Dashboard
I have also built a live Marktplaats Dashboard that shows me every day how the advertised stock performed the day before: how many VDP views per car, how many favourites and how many leads. On top of that, the Top 10 most visited VDPs, the Top 10 most favourited models of that day and, even more importantly, the Top 10 with the least activity: the cars that need extra attention.
On Marktplaats I can see this clearly, because the VDP views are shown under every listing and I only need to calculate the daily delta. Now that I have been working on this for a while, I am getting more ideas about how to get more out of that data. Especially from the data of the cars you have sold. What does that data tell you?
Hard to compare
For every car sold, whether through Marktplaats, AutoScout24 or viaBOVAG, I look at what that car actually did. How many views, how many favourites, how many leads, how many days, and what was the median price? That last one is tricky. I look for a comparable car, from the same model year and with the same mileage, and then compare the prices of franchised dealers, independent dealers and private sellers. That works fine with a Lynk & Co, but any German car with more than 1,000 variables is almost impossible to compare. So here is what I do: once I have three comparable sold models, such as a 2022 Opel Corsa 1.2, I calculate the benchmark for that dealer. What does that dealer need to sell this car next time?
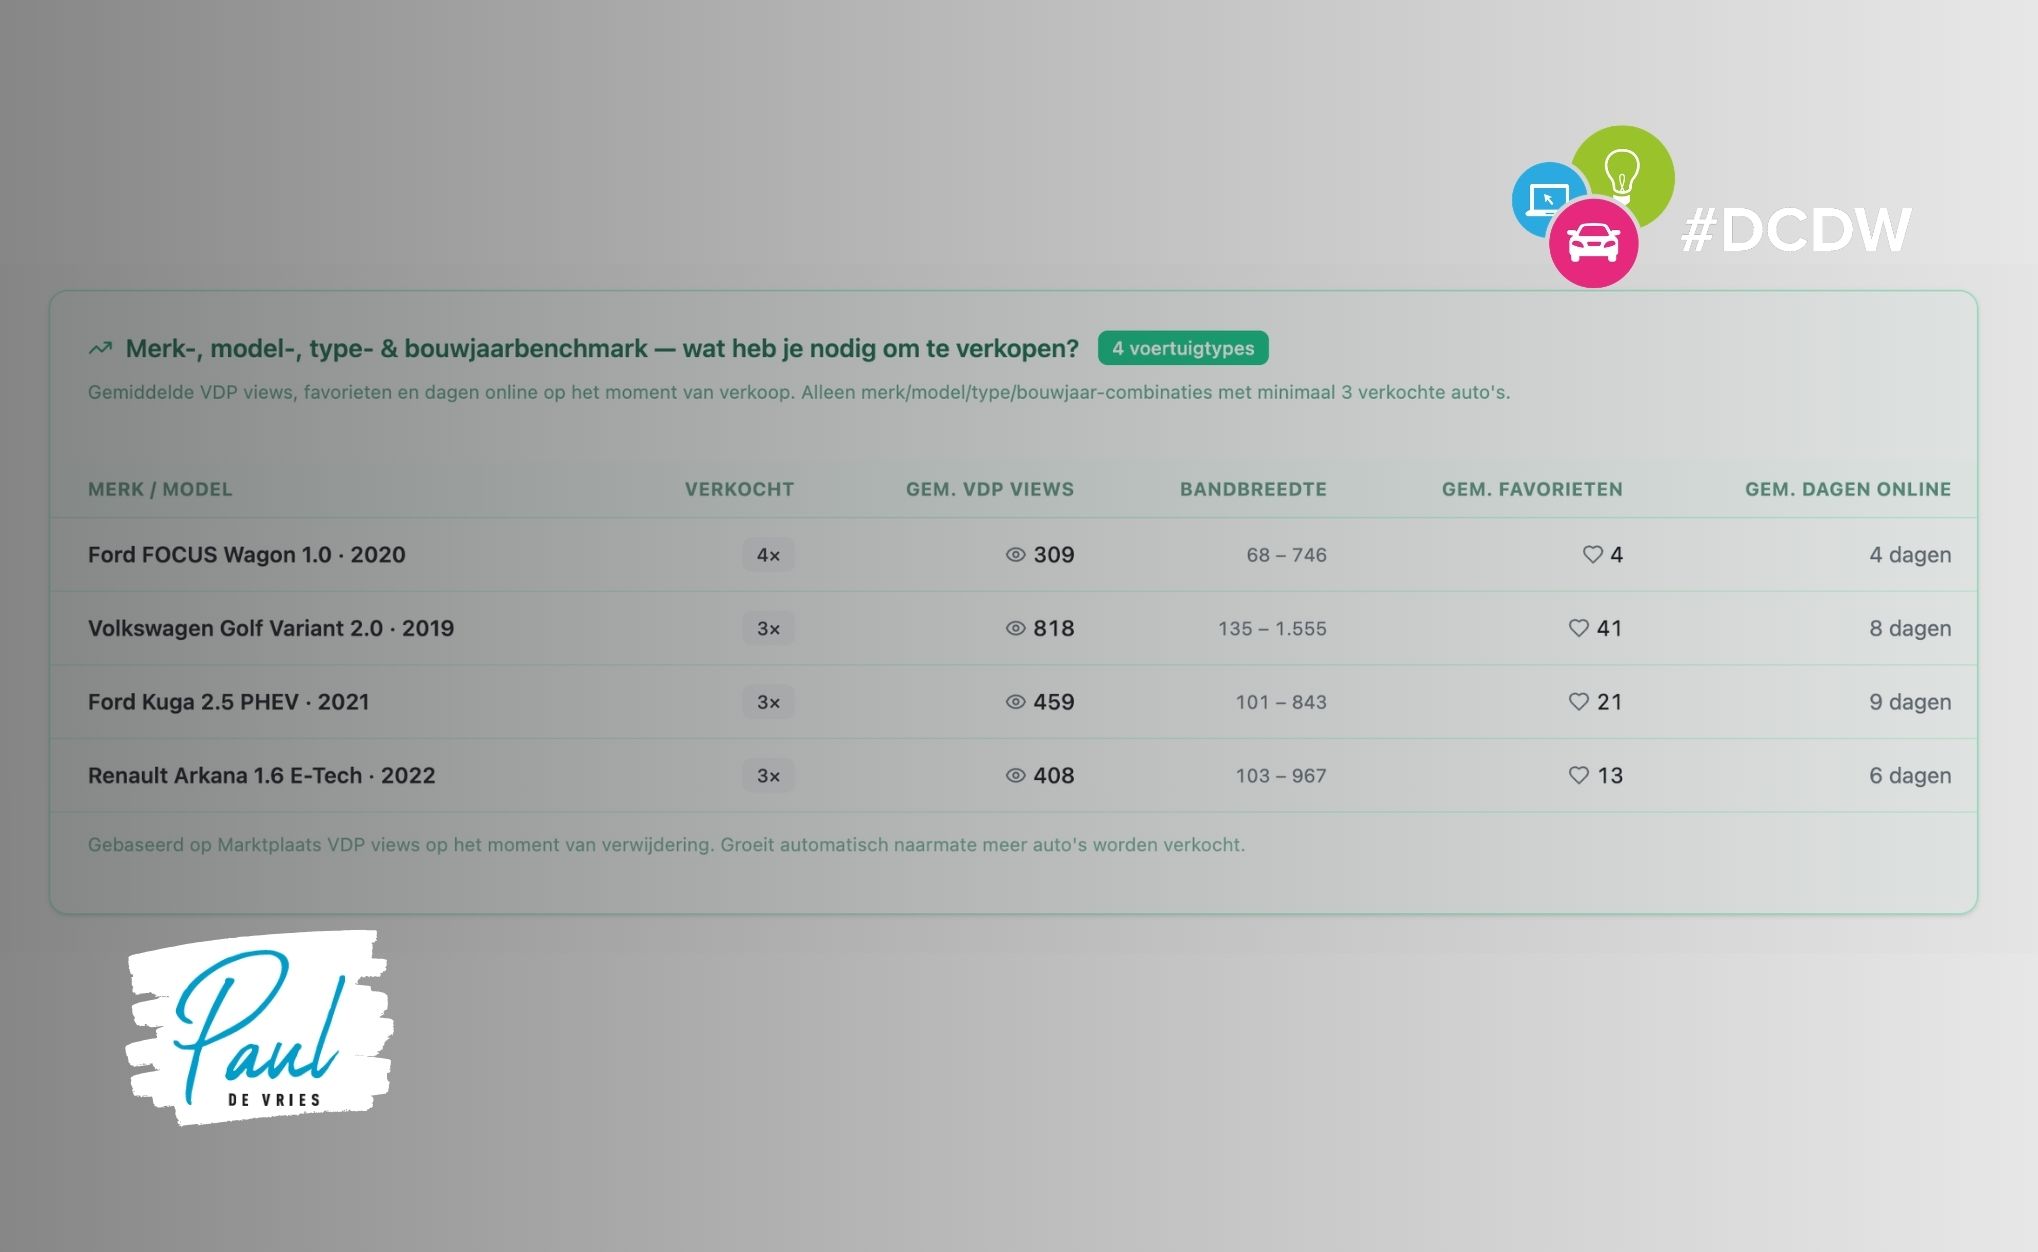
Benchmark based on at least 3 sold cars
Ford Kuga PHEV
Take the Ford Kuga PHEV: three cars sold, all three from 2021. It is a first benchmark, based on three cars within a dataset that now holds more than 100 sold cars. It is still a bit thin, I admit. But it is the first figure I have. If a 2021 Kuga comes in now, I know I need to aim for around 459 views and 21 favourites to sell it. If I know that as a salesperson, I can also speed it up. For example by using a daily or weekly top placement, so I reach those numbers faster. Instead of waiting and only reaching those numbers after 40 days, by which time I may no longer get the price I originally had in mind. And the more cars enter the dataset, the sharper the benchmark per model and model year becomes.
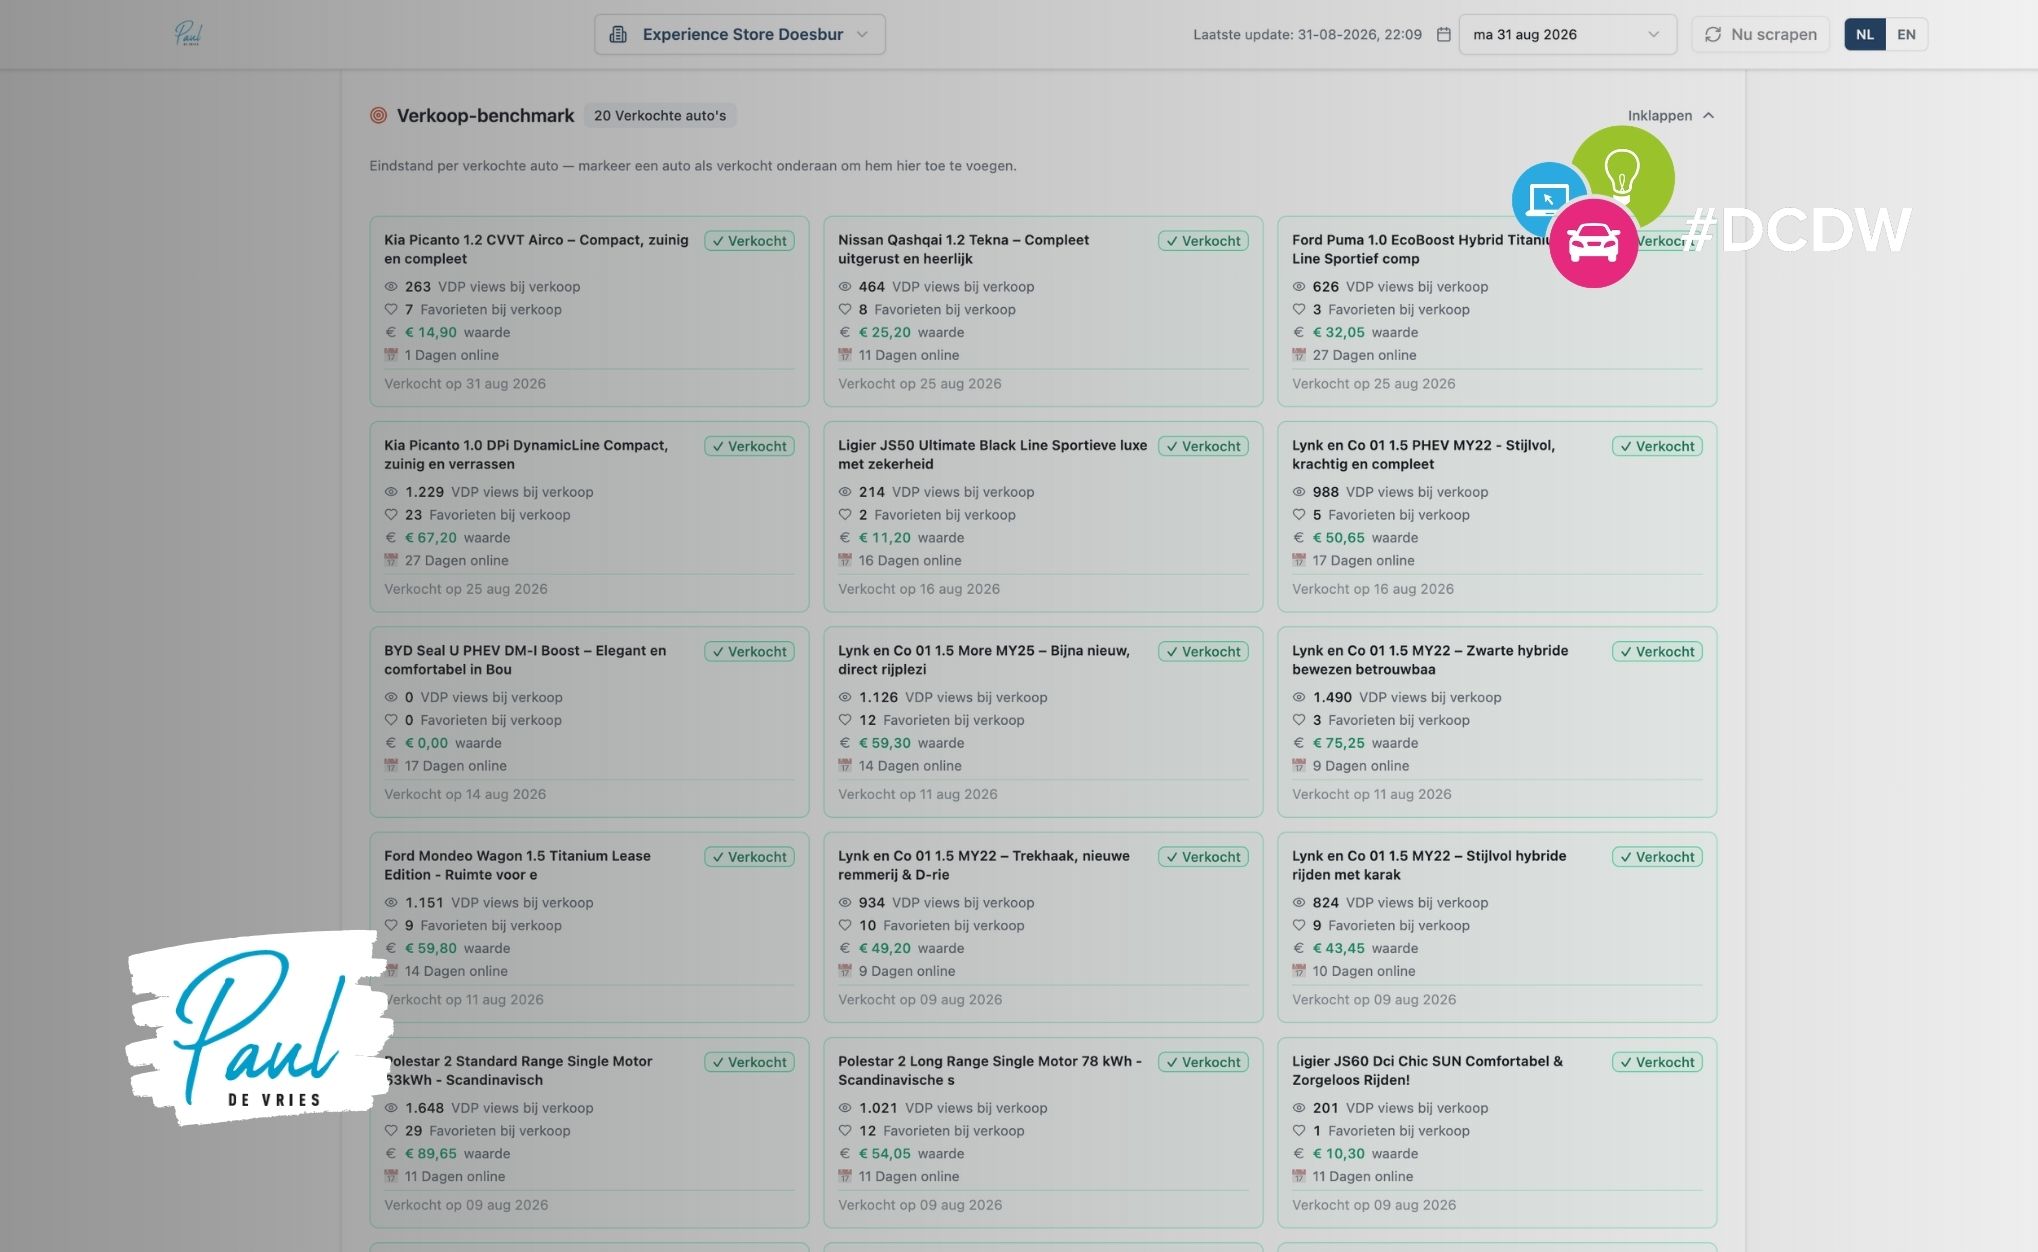
Various cars sold!
ROI Dashboard
All in all, the dashboard gives me peace of mind. Peace of mind because I know what Return On Investment (ROI) each portal delivers, seen through a marketing lens. After all, advertising on portals is no guarantee that you will sell. In my view, it is nonsense to trace a €1,000 investment in portal X back to the two orders you got directly from that portal, while forgetting the value of the 30 leads you were unable to close and dismissing the 15,000 VDP views as irrelevant. If you do calculate it that way, you end up at €500 per order. But that points to a problem in the sales process rather than marketing having spent that €1,000 badly.
In my view, it is nonsense to trace a €1,000 investment in portal X back to the two orders you got directly from that portal, while forgetting the value of the 30 leads you were unable to close and dismissing the 15,000 VDP views as irrelevant.
You can join
I am still looking for dealers and car companies who want to take part in the dashboard and receive their own dashboard from me. Free of charge! You pay me back in feedback, to make the dashboard even better. Every month you upload the statistics of each portal, together with the corresponding invoice, and the dashboard turns it into one comparison. Apples to apples. Only then do you get real insight into the value each portal offers you from a marketing perspective.